
Hello,
I have created request for sentinelhub to to download image. before saving the image to the disk I display the image with plot_image, and it looks good, but then when I reopen the image with rasterio I get blank image. When I print the image as array it has unexcpected values, with values between 7-8906. That’s een though Ihave used normalizatio nfactor for it to be reflectance.
This is what I have done:
#step 1: evaluate script + dusplay the image, then save it to disk):
evalscript_all_bands = """
//VERSION=3
function setup() {
return {
input: [{
bands: ["B01","B02","B03","B04","B05","B06","B07","B08","B8A","B09","B10","B11","B12"],
units: "DN"
}],
output: {
bands: 13,
sampleType: "INT16"
}
};
}
function updateOutputMetadata(scenes, inputMetadata, outputMetadata) {
outputMetadata.userData = { "norm_factor": inputMetadata.normalizationFactor }
}
function evaluatePixel(sample) {
return [sample.B01,
sample.B02,
sample.B03,
sample.B04,
sample.B05,
sample.B06,
sample.B07,
sample.B08,
sample.B8A,
sample.B09,
sample.B10,
sample.B11,
sample.B12];
}
"""
request_all_bands = SentinelHubRequest(
data_folder='imgs',
evalscript=evalscript_all_bands,
input_data=[
SentinelHubRequest.input_data(
data_collection=DataCollection.SENTINEL2_L1C,
time_interval=time_interval,
mosaicking_order='leastCC'
)],
responses=[
SentinelHubRequest.output_response('default', MimeType.TIFF)
],
bbox=bbox,
size=bbox_size,
config=config
)
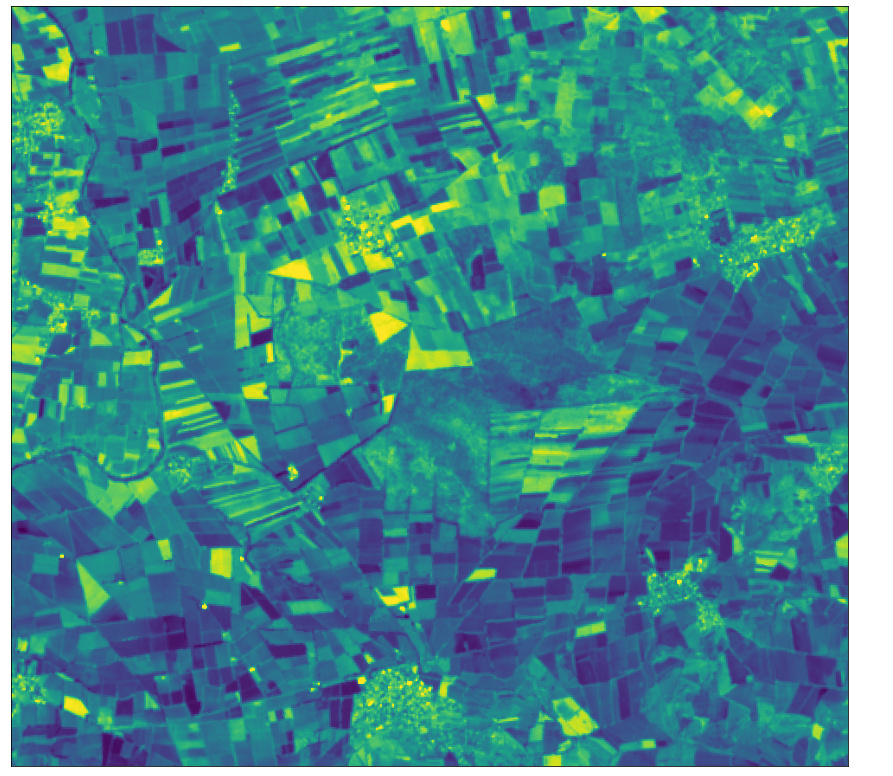
all_bands_img = request_all_bands.get_data(save_data=True)
plot_image(all_bands_img[0][:, :, 12], factor=3.5/1e4, vmax=1)
print(f'The output directory has been created and a tiff file with all 13 bands was saved into ' \
'the following structure:\n')
for folder, _, filenames in os.walk(request_all_bands.data_folder):
for filename in filenames:
print(os.path.join(folder, filename))
# try to re-download the data
all_bands_img_from_disk = request_all_bands.get_data()
# force the redownload
all_bands_img_redownload = request_all_bands.get_data(redownload=True)
step 2 : loas with rasterio and display as rgb:
mport rasterio
from rasterio.plot import show
img = rasterio.open('imgs/efd033b10e3ba9e660bf1d97dd111fdb/response.tiff')
#image information
print(' ')
#number of bands
print('number of bands',img.count)
#number of raster columns
print('number of columns:',img.width)
#number of raster rows
print('number of rows:',img.height)
plt.figure(figsize=(20,10))
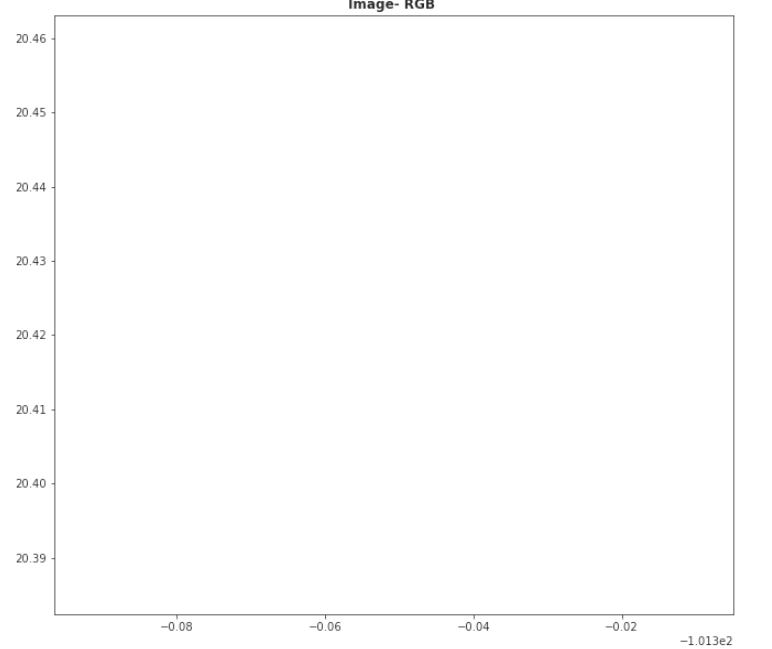
show(img.read([4,3,2]),transform=img.transform,title='Image- RGB ',vmin=0,vmax=8000)
array=img.read()
>>>
number of bands 13
number of columns: 968
number of rows: 879
and the image is blank:
when I print the array I get the values which I am not sure in which unit they are:
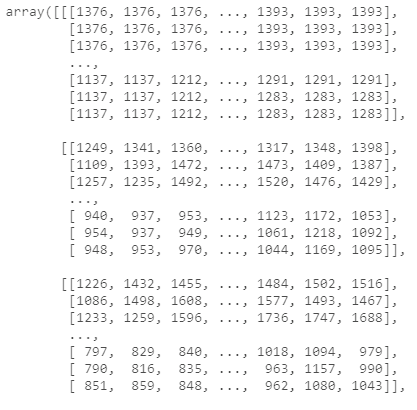
My question is why do I get the image blank? what are the units of this image? can I get it in surface reflectance (for example to acess the sentinle2a which gives me error right now)?