I am calculating NDVI from S2-L2A images downloaded from Copernicus Open Data using sentinelsat in QGIS(raster calculator) & following this tutorial (I saved xarray to tif for comparison). I observe that the values obtained are different from both the methods, as original band values also differ by around 1000, hence the mean also varies & there is significant difference among the two means obtained for my interest area. I used a recent image of year Nov’2022. The mean value obtained from sentinelsat images is low as compared to NDVI from the pystac method. (for same area of interest)
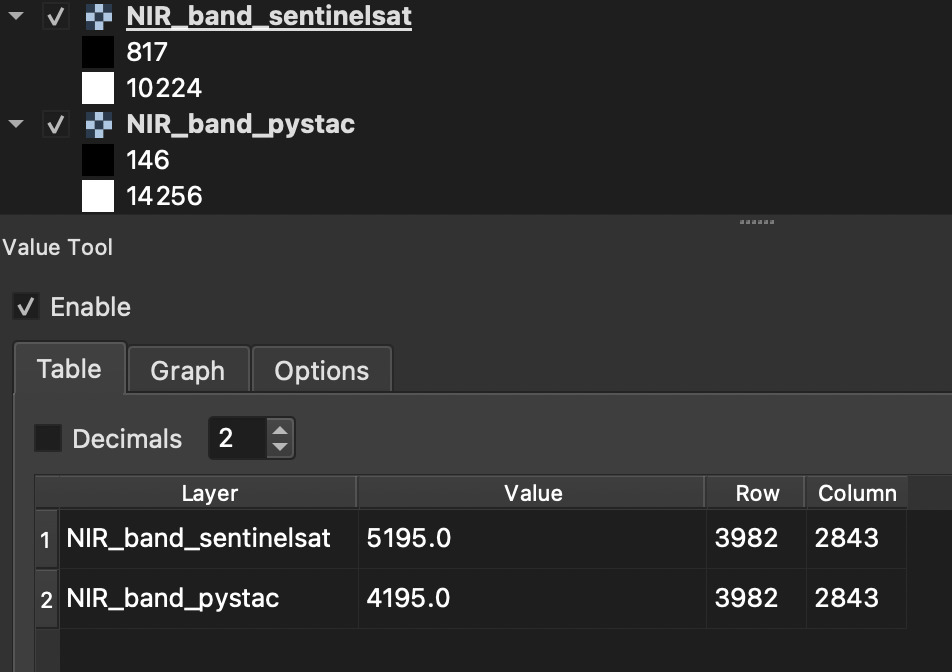
I am also confused about the values for individual bands I am getting, are these values DN or reflectance, as per the documentation and values I think both are reflectance multiplied by 1000. The image shows comparison for the values for NIR band (Band 8) for both sources, as we can see both max & min values are different for both sources and also the value at a point is different by 1000 (which is due to the harmonisation changes), which NDVI is correct & I should follow ?