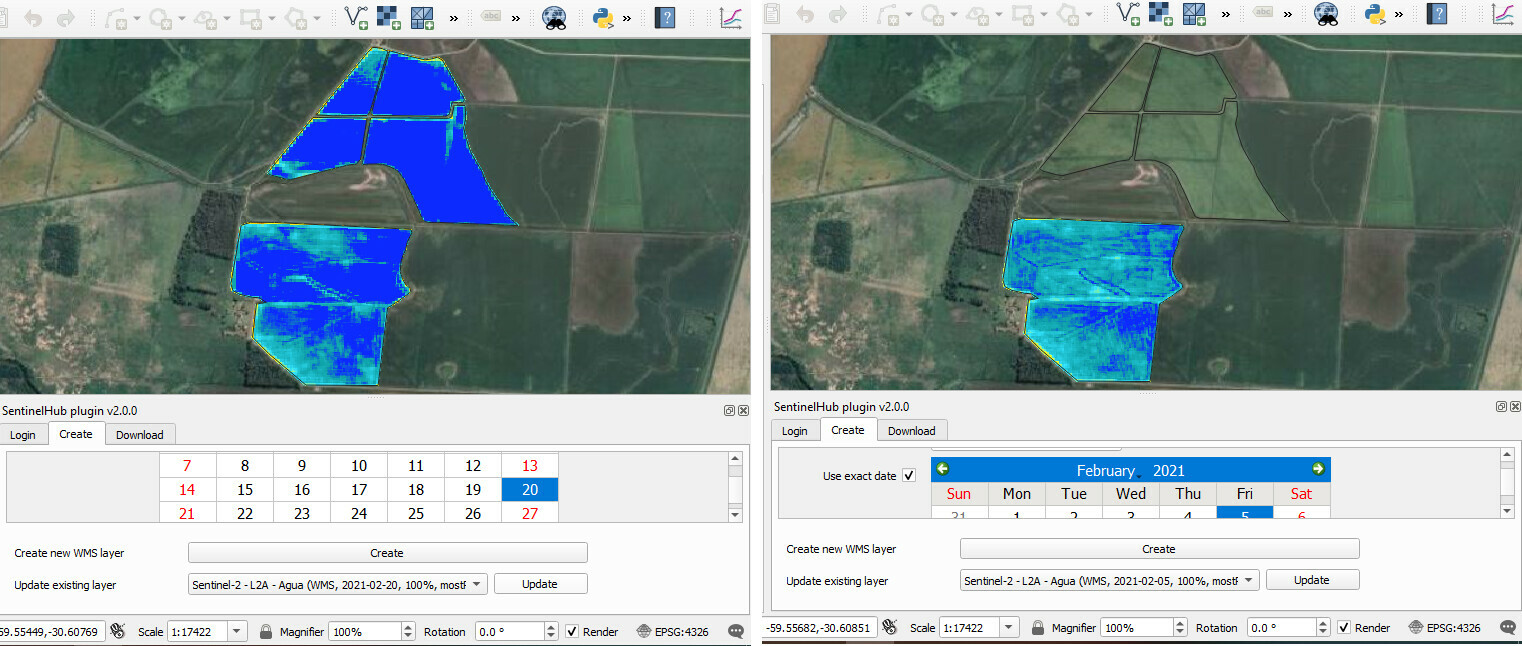
I´m trying to see an index derived from a configuration utility in QGIS using the SH Plugin. The visualization works well except for an specific date (2021-02-05) when only one of the polygons shows the index. Any other date would work as it can be seen in the left image where the 5 polygons show the index. I tried to move the minimum and maximum values to be shown but it did not work. What can be the issue here? Thanks.